
YouTube Average Views Calculator
Calculate a channel’s average and median views across the last 10 to 100 uploads or videos published in the past 30 to 365 days.
Calculating averages
| Title | Views | Published | Link |
|---|
The YouTube Average Views Calculator calculates the mean number of public views per video for a channel sample. You can analyze the channel’s last 10 to 100 uploads or select videos published during the past 30 to 365 days.
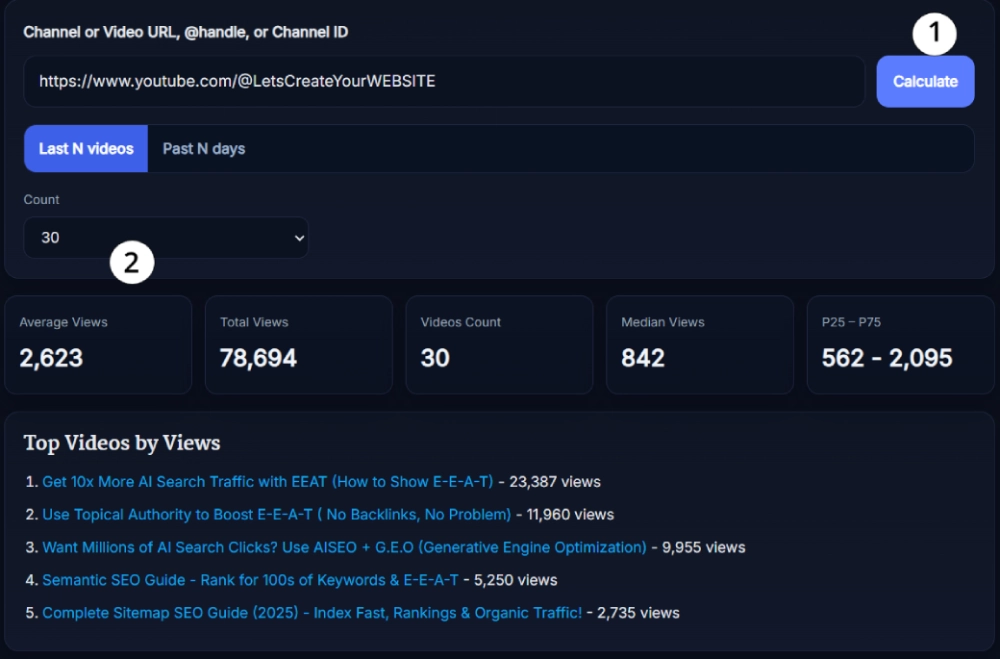
Paste a YouTube channel URL, video URL, @handle or channel ID to begin. The results include average views, total views, video count, median views, P25–P75, five top-performing videos and a detailed table of every video included in the calculation. No YouTube sign-in is required.
How the YouTube Average Views Calculator Works
The basic calculation is straightforward:
Average views per video = Total public views in the selected sample ÷ Number of videos analyzed
For example, if the selected videos have 500,000 combined views and 20 videos are analyzed, the average is 25,000 views per video. The Videos Count result confirms how many videos were actually used in the calculation.
The calculator also sorts the view counts to produce a median and P25–P75 range. These additional figures help you see whether the average represents most uploads or has been pulled upward by one or two unusually popular videos.
Supported Inputs and Analysis Options
The input field supports several common ways of identifying a YouTube channel:
- A YouTube channel URL
- A YouTube video URL
- An @handle
- A YouTube channel ID beginning with UC
When you enter a video URL, the tool identifies the channel that published the video. It then analyzes the selected channel sample. It does not calculate only the pasted video.
Two sampling modes are available:
- Last N videos: Choose the latest 10, 20, 30, 50 or 100 available videos.
- Past N days: Analyze available videos published during the past 30, 60, 90, 180 or 365 days.
The final Videos Count may be lower than the requested count when fewer public videos are available. In time-window mode, the number can also vary according to the channel’s publishing frequency.
How to Use the YouTube Average Views Calculator
- Paste a channel URL, video URL, @handle or channel ID into the input field.
- Select Last N videos or Past N days.
- Choose the required video count or number of days.
- Select Calculate.
- Review the average, median, P25–P75 and total view figures.
- Check the top-five list and analyzed-videos table for individual results.
Understanding the Results
Each result answers a slightly different channel-performance question:
- Average Views: The total public views divided by the number of analyzed videos.
- Total Views: The combined current public view counts of the selected videos.
- Videos Count: The actual number of videos included in the calculation.
- Median Views: The middle result after the videos are ordered by view count.
- P25–P75: The range containing the middle 50% of view counts in the sample.
- Top Videos by Views: The five videos with the highest public view counts in the sample.
- Analyzed Videos: A table showing each title, view count, publication date and YouTube link.
Average Views Versus Median Views
Average and median can tell noticeably different stories. The average includes the effect of every video, so one viral upload can pull it much higher. The median identifies the middle of the sample and is less affected by extreme results.
If average and median are close, the sampled videos probably have a relatively even distribution. If the average is far higher than the median, a small number of high-view videos may be responsible for much of the total.
Neither number is automatically better. Use the average to understand total view volume per upload and the median to understand the middle result in the selected sample.
What Does P25–P75 Mean?
P25–P75 is the interquartile range. It describes the middle 50% of analyzed view counts after the videos are arranged from lowest to highest.
- P25 is the point at or below which roughly 25% of the sampled results fall.
- P75 is the point at or below which roughly 75% of the sampled results fall.
- Results below P25 belong to the lower quarter of the sample.
- Results above P75 belong to the upper quarter of the sample.
This range helps describe consistency, but it is not a promise, forecast, minimum view guarantee or official YouTube performance score.
Important Difference in Past N Days Mode
Past N days selects videos according to their publication dates. The calculator then uses each selected video’s current cumulative public view count.
For example, Past 30 days means videos published during the last 30 days. It does not mean views gained by the channel during those 30 days. Measuring views earned within a specific period requires the channel owner’s YouTube Analytics data.
Public View Count Limitations
The YouTube Average Views Calculator uses available public video information. It cannot access private YouTube Studio metrics such as watch time, audience retention, traffic sources, unique viewers or revenue.
YouTube explains that public engagement metrics can take time to update and may be adjusted while the platform confirms legitimate activity. The YouTube Data API documentation also notes that a Short’s public view count has included starts and replays without a minimum watch-time requirement since March 31, 2025.
The calculator does not provide a Shorts or long-form filter. If both formats appear in the selected sample, interpret the average carefully because they may accumulate views in different ways. Comparing consistent timeframes and similar content formats usually produces a more useful channel benchmark.
What Average Views Does Not Measure
Average views per video should not be confused with average view duration, average percentage viewed or average views per viewer. Those are separate YouTube Analytics metrics.
This result also does not measure engagement quality, guarantee future performance or estimate revenue. To compare likes and comments with views, use the YouTube Engagement Rate Calculator. To compare channel views with subscriber count, try the YouTube Views Ratio Calculator.
Tips for More Useful Comparisons
- Use the same sample size when comparing channels or checking changes over time.
- Remember that older videos have had more time to collect views than newly published videos.
- Check the median whenever one video appears unusually large.
- Review P25–P75 to understand the spread of the middle results.
- Use the individual video table to identify which uploads are affecting the average.
- Be careful when the sample contains both Shorts and standard videos.
- Run the calculation again later because public view counts can change.
Frequently Asked Questions
What does the YouTube Average Views Calculator calculate?
It calculates the mean public view count for the videos in a selected channel sample. It also displays total views, video count, median views, P25–P75, five top videos and a table of the analyzed videos.
Which YouTube inputs does the calculator accept?
It accepts a YouTube channel URL, a video URL, an @handle or a channel ID. A video URL is used to identify the video's channel, so the result still analyzes that channel's selected sample.
How is average views per video calculated?
Average views per video equals the total public views of the videos in the selected sample divided by the number of videos analyzed. The Videos Count card shows the denominator used.
What is the difference between Last N videos and Past N days?
Last N videos analyzes a fixed sample of 10, 20, 30, 50 or 100 recent videos. Past N days analyzes available videos published during the last 30, 60, 90, 180 or 365 days using their current public view counts.
Does Past N days show how many views the channel gained during that period?
No. It selects videos by publication date and then averages their current cumulative public view counts. It does not measure views gained by the whole channel during that date range.
Why can average and median views be different?
The average responds to every value, so a viral upload can raise it considerably. The median is the middle result after sorting the sample. A large difference indicates an uneven sample, not a calculation error.
What does P25–P75 mean?
P25–P75 represents the middle 50% of the sampled view counts. Roughly one quarter falls at or below P25 and one quarter falls at or above P75. It describes the distribution and is not a guaranteed minimum or maximum.
Does the calculator separate YouTube Shorts and long-form videos?
No. It does not offer a content-type filter, so the selected sample may contain both Shorts and standard videos. Interpret mixed samples carefully because the formats can accumulate public views differently.
Is average views per video the same as average view duration?
No. Average views per video is the mean number of public views across several videos. Average view duration measures watch time per view and is available to the channel owner through YouTube Analytics.
What is a good average number of views on YouTube?
There is no universal good average. A useful comparison considers the same channel, similar video formats, comparable video ages and a consistent sample size. Subscriber count, niche and publishing frequency can also affect the context.