Youtube Channel Comparison
Compare full YouTube channels: subscribers history, cadence, Shorts ratio, and estimated earnings.
Do-follow · Permanent · No middlemen
If 30-day view snapshots exist, earnings use the true monthly delta. Otherwise we use a conservative fallback until history builds.
We started recording history today. This chart will grow each day you compare these channels.
This tool compares two YouTube channels side by side and turns messy stats into clean insights. Paste two handles or URLs, hit Analyze, and you’ll get growth charts, upload cadence, Shorts ratio, and realistic earnings ranges based on your CPM inputs.
What the Youtube Channel Comparison Tool Does
This tool shows how two channels stack up using real channel data, not guesses. You see subscribers, total views, uploads, average views per video, last-30-days activity, cadence per week, Shorts ratio, average video duration, and channel age. It also plots subscribers or views on a timeline chart and estimates daily, monthly, and yearly earnings using your CPM range.
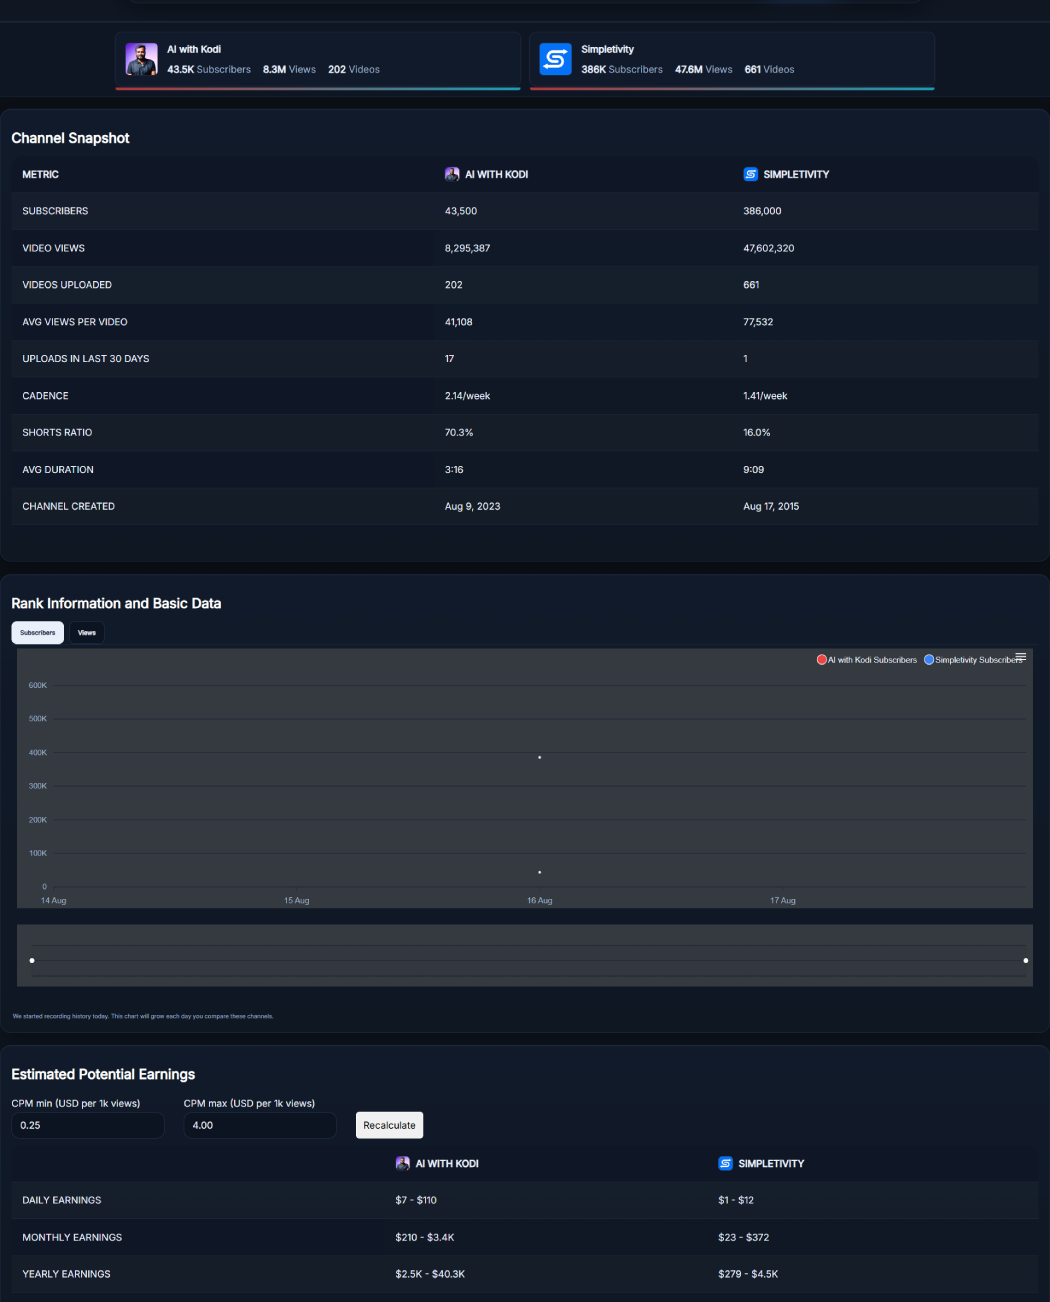
Once you run an analysis, the page displays two compact channel cards with avatar, subscribers, total views, and videos count. Below that, a Channel Snapshot table lines up every metric for both channels, row by row, so your eyes can scan across and spot the winner. A chart labeled Rank Information and Basic Data lets you flip between Subscribers and Views to visualize growth patterns. Finally, an Estimated Potential Earnings box takes your CPM min and max and recalculates what each channel might be making.
Key Features for Competitive Research
- Two-field comparison input: Short, simple UI. Enter a channel handle like @example or paste a full channel or video URL. Click Analyze and both profiles load together.
- Channel Snapshot table: One grid, two columns, all the essentials. Subscribers, total views, uploads, average views per video, uploads in last 30 days, weekly cadence, Shorts ratio, average duration, and date created.
- Growth chart with toggle: Switch between Subscribers and Views. The chart shows points by date with a clear legend for each channel, so trends are obvious at a glance.
- Earnings estimator with CPM controls: Enter your CPM min and max, then hit Recalculate. The tool returns daily, monthly, and yearly ranges for each channel based on recent view profiles.
- Clean, dark UI for focus: Cards, toggles, and table stripes are easy on the eyes. The layout highlights differences without crowding the screen.
- Mobile-ready layout: Inputs, chart, and tables are stacked nicely on small screens, so you can compare channels on the go.
How to Use Youtube Channel Comparison
- Add two channels: Use the Handle 1 and Handle 2 boxes. You can paste @handle, a channel URL, or even a video URL if you often start from content rather than the channel page.
- Click Analyze: Hit the Analyze button. The page loads two channel badges showing avatar, subscribers, total views, and videos count. You’ll also see a subtle highlight indicating which channel is currently selected at the top.
- Scan the Channel Snapshot table: Scroll to the table labeled Channel Snapshot. Compare rows like Subscribers, Video Views, Videos Uploaded, Avg Views Per Video, Uploads in Last 30 Days, Cadence per week, Shorts Ratio, Average Duration, and Channel Created. The format is simple. One metric per row, the two channels side by side.
- Check the growth chart: In Rank Information and Basic Data, use the tiny tabs or buttons to switch between Subscribers and Views. Points on the chart are labeled by color for each channel. You can quickly see spikes, plateaus, and steady grinders.
- Estimate earnings: In Estimated Potential Earnings, set CPM min and max. For most niches, try something like 0.25 to 4.00 USD to start. Click Recalculate. The tool outputs daily, monthly, and yearly estimates for both channels so you can sense monetization potential, not just vanity numbers. If you want to validate revenue ranges further, you can cross-check with the YouTube Money Calculator or, for Shorts-heavy channels, the YouTube Shorts Earnings Calculator.
- Iterate: Want to test a different rival? Change a handle, click Analyze again, and the whole comparison refreshes. Keep your CPM settings if you’re studying a single niche.
Benefits of Using Youtube Channel Comparison
- Instant clarity: Instead of bouncing between multiple tabs and spreadsheets, the tool lines up two channels on one canvas. You can find the stronger performer in seconds.
- Actionable monetization insight: Seeing earnings tied to CPM ranges helps you judge whether a channel’s views are translating into likely dollars. It’s far more helpful than a bare subscribers count.
- Growth pattern recognition: The chart visualizes whether a channel is steady, spiky, or stagnant. If a competitor’s views climb right after upload days, you’ll spot their cadence strategy.
- Content strategy hints: Shorts ratio and average duration tell you how each channel balances short-form volume with long-form depth. That’s gold when you’re planning your own format mix.
- Launch benchmarking: If you’re starting fresh, compare your channel to mid-sized players in your niche. Use their cadence and last-30-days uploads as a realistic target.
- Lightweight workflow: No logins or complicated filters. Paste two handles, analyze, adjust CPM, done. It’s fast enough to use during client calls or brainstorming sessions.
Real Example of a Head-to-Head Analysis
Let’s say you manage a productivity channel. You compare Channel A and Channel B. The table shows Channel A has 43k subscribers and 8.3M total views with 202 uploads. Channel B has 386k subscribers and 47.6M views with 661 uploads. At first glance, B is bigger. But look closer.
Average views per video tell another story. If A’s average per video is strong relative to its size, that usually means tighter topics or a sticky audience. Check uploads in the last 30 days. If A posted 17 times and B only posted once, A is in a momentum phase. Cadence per week makes that crystal clear.
Now hit the chart and switch to Views. See any spike clusters after specific days? That hints at an upload schedule. If spikes hit mid-week, you’ve got a timing clue. Finally, drop in your CPM window. Let’s say 0.25 minimum and 4.00 maximum. Click Recalculate. You’ll see daily, monthly, and yearly earnings ranges for both. Sometimes the smaller channel with a higher recent activity plus a healthy average views per video produces surprisingly competitive earning potential. That’s precisely the kind of nuance the Youtube Channel Comparison workflow exposes. To judge audience quality alongside growth, many creators also open the YouTube Engagement Rate Calculator in parallel.
Pro Tips for Getting the Best Results with Youtube Channel Comparison
- Use niche-appropriate CPM: Lifestyle channels often run lower CPMs than finance or B2B. Start with your niche average, then test a higher and lower band to see sensitivity.
- Compare channels of similar size: Apples to apples helps you learn faster. If you do compare a small channel to a giant one, focus on cadence, Shorts ratio, and average views per video for growth cues.
- Watch the last 30 days: Fresh uploads tell you who’s actually active. A dormant channel with a big historic base might look strong until you notice recent activity is near zero.
- Balance Shorts and long-form: A high Shorts ratio can inflate subscriber growth but sometimes lowers average duration. Use both metrics together to judge the true content mix.
- Track changes weekly: Run the same comparison every week. Save screenshots. Over a month, that timeline shows whether experiments are working.
- Use a “control” channel: Always keep one proven performer in your comparisons. It’s your anchor. Swap out the second input to test new rivals or aspirational targets.
- Read between the lines: If a channel uploads rarely but average views per video are high, they might rely on evergreen topics. If cadence is high but averages are low, the strategy may be volume over depth.
FAQ
How accurate are the earnings estimates in Youtube Channel Comparison?
They’re estimates based on the CPM range you provide. CPM varies by country, audience quality, season, and niche. Use a conservative range at first, then refine after checking your own analytics. The goal is to gauge potential, not predict exact payouts.
Can I compare a handle with a full channel URL or a video URL?
Yes. The tool accepts @handles and channel URLs. It also supports video URLs, which is handy if you discover competitors via a single video. Paste either value into the input boxes, click Analyze, and the page resolves the channel for comparison.
What does Shorts ratio tell me?
It’s the percentage of a channel’s recent content that’s Shorts. A high ratio might indicate a growth strategy focused on quick hits. Pair this with average duration and average views per video to understand whether Shorts are building reach or just inflating activity.
Why do my chart points look sparse on certain days?
That usually means limited data points or low activity during that period. Switch between Subscribers and Views to see which metric reveals more. Over a few weeks, the timeline fills in and patterns become clearer.
What CPM range should I start with?
If you’re unsure, try 0.25 to 4.00 USD as a baseline. Many general niches fall somewhere in there. For higher-value niches like finance, B2B software, or real estate, test a higher range and compare the difference.
Is the tool useful for brand sponsorship planning?
Yes. Brands can compare potential partners quickly. Look at cadence, last-30-days uploads, and average views per video to identify consistent reach. Add a niche-specific CPM range to see if the estimated monthly earnings align with your budget assumptions.
Can I use Youtube Channel Comparison on mobile?
Absolutely. The layout adapts to smaller screens. Inputs stack nicely, the Channel Snapshot is scrollable, and the chart remains readable. You can test multiple rival channels from your phone without losing context.
What’s the difference between total views and average views per video?
Total views show the lifetime scale of a channel. Average views per video reveal the typical performance of a single upload. A channel can have huge lifetime views but weak recent averages, which may indicate an aging audience or hit-driven history.
How do I judge a realistic upload cadence for my niche?
Use the Cadence and Uploads in Last 30 Days rows as a guide. If top channels in your niche average 2 to 3 videos per week, it’s a good initial benchmark. Blend that with your team’s capacity and quality standards before aiming higher.
Can I export the results?
Right now the tool focuses on fast, on-page analysis. A simple workaround is to save a PDF print of your comparison or capture a screenshot for weekly tracking. Many creators build a small Notion or Google Sheet to store snapshots over time.